When it comes to racial differences in intelligence, the average differences in cranial capacity are an important piece to the puzzle. Whatever their ultimate cause (i.e. whether due to environmental differences or genetic differences that resulted from environmental differences), they establish the deep roots of general mental ability differences. In their recent discussion of race, genes, and IQ, Hunt and Carlson (2007) maintain that differential brain size is a reasonable line of investigation:
Rushton (1995) maintained that one of the reasons for the White–African American disparity in IQ scores is that Whites have larger brain sizes than African Americans. Leaving aside the issue of whether or not one accepts this particular argument, the argument itself illustrates a useful principle. Differences in brain size are associated with intelligence (McDaniel, 2005). Rushton has stated a hypothesis about a biological mechanism, known to influence intelligence, that might explain the difference. Rushton’s claim for a racial disparity in brain sizes was based on exterior skull measures. Further studies, using modern imaging techniques, may provide a more sensitive test of the hypothesis. It would not be appropriate to enter into a detailed discussion here. Our point is simply that discussing this sort of claim is far more likely to increase our understanding of the disparity than is arguing about the percentage of variance associated with biological or environmental variables.
What is the status of this line of investigation?
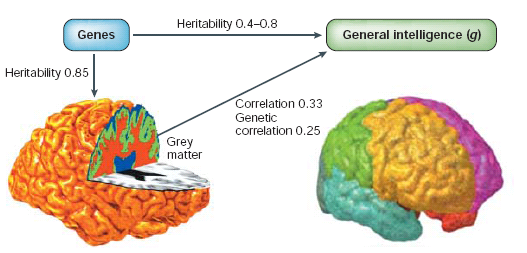
Obviously, for the brain size explanation to be plausible brain size, cranial capacity, and head circumference need to correlate with differences in intelligence within populations; moreover, brain size, cranial capacity, and head circumference need to be partially heritable. Rushton and Ankney (2009) summarize the findings to date with regards to brain size and intelligence: based on 28 non-clinical published brain imaging samples (N= 1,389) a .40 correlation between IQ and brain size measured by MRI was found; based on 59 published samples (N= 63,405) a .20 correlation between IQ and head circumference was found. These findings are consistent with others. In a meta-analysis McDaniel (2004) found an in vivo brain volume/IQ correlation of 0.33 based on 37 published studies (N= 1535); Reviewing all the data to date (N = 935), Miller and Penke (2007) found a in vivo brain volume/general intelligence (GQ) of .41; the heritability of adult brain volume (N =2494) was found to be .89. Pietschnig, Zeiler, and Voracek, (submitted), found an in vivo brain volume/IQ correlation of .24 based on a meta-analysis of 94 studies published and unpublished.
With regards to the heritability of brain size, based on a review of 14 twin studies using CT to measure brain size, Peper et al. (2007) found a .81 heritablity of global brain measures, .66-97 heritability of brain volume, and .82/.88 heritability of grey/white matter. Moreover, based on a twin study, Posthuma et al. (2002) found a .30 genetic correlation between general intelligence and brain volume, replicating the findings of Pennington et al. (2000), who found a genetic correlation of 0.48 (as cited in Gignac et al, 2003). So, within populations, one can infer a genetic basis to intelligence differences, partially mediated by differences in brain size.
This conclusion is confirmed by the preponderance of the evidence which shows a within family correlation between brain size and IQ (Gignac et al, 2003; Rushton and Jensen, 2010).
In addition to the above two prerequisites, there must be consistent findings of between population differences.
Cranial capacity differences between continental populations
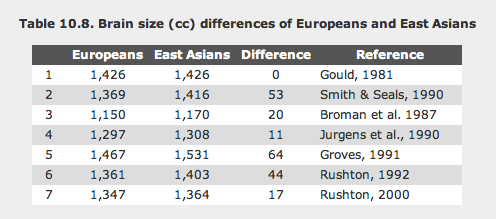
As for cranial capacity differences between regional populations, Beals, et al. (1984) found an average Asian, European, and African cranial capacity of, respectively, 1380, 1362 (sd = 35), and 1276 (sd =85) (N= 20,000); they attributed the selection to cold weather adaptation. (See: Smith and Beals (1990) for population means and standard deviations.) Rushton (2005) summarizes previous global findings: East Asians 1,364, Europeans 1,347, S.Africans 1,267. (See also: Rushton, 1990). Based on a recent study of 699 Nigerians of different ethnicities, Odokuma, et al. (2010) found a mean cranial volume of 1271.
Odokuma, et al. (2010) found a mean cranial volume of 1271; they conclude the following:
The findings in this study are similar to previous studies (Morton, 1839) where the mean cranial volume of the skulls of whites was 1,425 cm³, while that of the Blacks was 1,278 cm³. Based on the measurement of 144 skulls of Native Americans, Morton (1839) reported a figure of 1,344 cm³. Gould (1981) and Rushton (1995) have also showed very similar figures. Tribe had a significant effect on cranial volume at 0.05 levels of significance. Intercultural comparisons demonstrated significant variation as reported by Howells (1989), Froment (1992) and Lahr (1996). While the Ibo’s had an average cranial capacity of 1273.39 cm3 , that of the Urhobo’s was 1255.89 cm3. The Edo’s was 1310.08 cm3. This may be attributable to a . common ancestral origin of the Ibo and Urhobo people or inter marriages which are very common between these cultures with interchange of physical characteristics over the years since these people have been cordial neighbours
There is general acceptance of these findings in the physical anthropology literature. For example, in Chapter 5, Regional Variation and Evolution, of their textbook, Human Lineage, Cartmill and Smith (2009), acknowledge these differences, stating:
They conclude*, as do some others, that the differences are unrelated to IQ, but agree that the differences are genetic, in part. As others argue that the population differences are wholly environmental (e.g., Brody, 2003), it’s important to look at populations that share a common environment.
Cranial capacity differences between racial groups in the US
In the US, it seems that there is indeed a small average difference in cranial circumference between racial groups but more data is needed. (see: Rushton and Ankney, 1999).
Brain mass differences between racial groups in the US
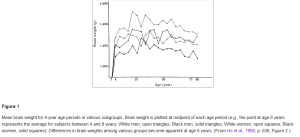
Jensen (1998) summarizes the brain mass findings from the Case-Western Reserve (1980) study(N= 811 W, 450 B). An age matched and height adjusted B-W differences of ~100g (~.78SD) was found, which is commensurate with the findings of Bean (1906), Mall (1909), Pearl (1934), and Vint (1934) as described in Rushton and Ankney (2009). Holloway (2002) found a B-W difference of 63 grams (N = 1,391 W; 615 Black). Similar findings have been found based in imaging studies (see 5). In their study, Isamah, et al. (2010) found that African Americans have 1 SD less total cerebrum volume than European Americans.
Overall, it looks like there’s some consistency among the findings. The results have been numerously replicated, as summarized by Lynn (2006).
Next there must be plausible accounts for selective pressure, relating population differences, brain size, and intelligence. Bailey and Geary (2010) found the following correlations based on the location of 175 archeological sites dating from 1.9 million to 10 thousand years ago.
Cranial capacity positively correlates with latitude and population density both which are positively intercorrelated. It negatively correlates with parasite load and mean temperature.
This conforms with the major evolutionary-hereditarian explanations: Population Density (1), Paleoclimate (2), Geographic Novelty (3), and Disease Burden (4). Ash and Gordon, in Ash and Gordon (2007), give a nice discussion of this perspective:
More recent studies on ASPM and MCPH1, as summarized by Montgomery (2010), bolster this case.
From an environmental standpoint, one would either have to argue that the between population differences in brain size don’t cause between difference in intelligence (a la Cartmill and Smith, 2009) or that the between differences in brain size, while related to differences in cognition, ultimately have an environmental origin. The former requires one to argue that different populations are wired differently, say in the manner of males and females, so that genetic between population differences in size don’t entail between population differences in intelligence; this isn’t supported by within sex studies on brain functioning and structure; and the consistently positive size/IQ correlation within clinal populations (e.g., Sudanese, Guatemalans, African Americans, Asian Indians, Turks, Chileans, etc.) strongly argues against this (see: Rushton and Ankney, 2009). The latter is probably true to some extent; a complete environmental explanation, though, seems very implausible, for several reasons:
1) It requires one to discount the historical evidence which shows a consistent pattern of differences over time and which strongly suggests an adaptive origin to the differences.
2) As the racial population differences in cranial capacity are intercorrelated with numerous other musculoskeletal trait differences, arguing that the cranial capacity differences have a wholly environmental origin require one to maintain that the whole matrix of musculoskeletal trait differences likewise has an environmental origin. Which is implausible. As Rushton and Rushton (2001) note: “[R]ace differences in brain size are correlated with 37 musculoskeletal variables shown in standard evolutionary textbooks to change systematically with increments in brain size. The 37 variables include cranial traits (such as jaw size and shape, tooth size and shape, muscle attachment sites, and orbital bone indentations), and postcranial traits (such as pelvic width, thighbone curvature, and knee joint surface area). Across the three populations, the ‘‘ecological correlations’’ [Jensen, A. R. (1998). The g factor. Westport, CT: Praeger] between brain size and the 37 morphological traits averaged a remarkable r = .94; r = .94. If the races did not differ in brain size, these correlations could not have been found.” See also Rushton and Rushton (2004)
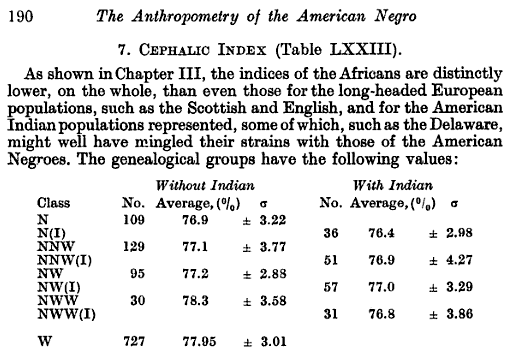
3) Classic studies of geological differences and Cephalic Indexes (CI) contradict a purely environmental hypothesis for differences. For example, Herskovits (1930), found the following association between genealogy an CI:
4) It has been found that population craniometric differences align with genetic differences. As Hubbe et al. (2009) note:
On the other hand, several studies have demonstrated a geographic structure in modern human craniometric diversity on a global level (e.g., Howells, 1973, 1989; Hanihara, 1996). Craniometric data have been found to follow a common geographic pattern with genetic markers, including both classical and microsatellite DNA markers (Relethford, 1994, 2004a, 2009; Manica et al., 2007; Betti et al., 2009). These findings have been interpreted as resulting from an isolation-by-distance model of evolutionary diversification. Furthermore, population relationships inferred from cranial morphology (as reflected both by traditional linear measurements and by 3D geometric morphometric data) have been shown to match those inferred from genetic data (Roseman, 2004; Harvati and Weaver, 2006a,b; Smith, 2009). Taken together, these results suggest that human cranial morphology preserves a relatively strong population history signal, in addition to a climatic and possibly also dietary/masticatory signal (e.g., Relethford, 2004a).
One effectively has to argue that the correlation between craniometric differences and genetic differences is spurious to maintain an environmental case.
Overall, given the reasons above, it seems probable that some of the differences in cranial capacity/brain volume have an evolutionary genetic origin. And, given the genetic correlations between brain volume and IQ, this seems to support a Brain size argument for genotypic IQ differences.
Notes
*Cartmill and Smith (2009) cite Deacon (1997). In the cited chapter, “The Size of intelligence: A gross misunderstanding,” Deacon, in fact, does not discuss intrahuman variation in intelligence or brain size. Rather, he argues, as the title of the chapters suggests, that bigger brains did not make humans smarter than other primates. (Cf. Reader (2011), “The evolution of primate general and cultural intelligence; Table 4. The relationship between primate general intelligence and brain volume).
In their discussion, Cartmill and Smith (2009( not only misrepresent Deacon’s chapter but, having brought up the issue, neglect to inform the readers about the copious amount of evidence that has accumulated internationally since the ’90s which establishes that bigger human brains are, indeed, smarter (McDaniel, 2005; Rushton and Ankney, 2009). Moreover, they cite Beals et al.’s thermoregulatory explanation for human variation without making mention that this climatic explanation is complementary with a size-intelligence one (e.g., Ash and Gordon 2007).
(1) Cochran, G., & Harpending, H. (2009). The 10,000-year explosion: How civilization
accelerated human evolution.
accelerated human evolution.
(2) Kanazawa, 2008. Temperature and evolutionary novelty as forces behind the evolution of general intelligence. Intelligence
Lynn, 1991. The evolution of race differences in intelligence
Templer and Arikawa, 2006. Temperature, skin color, per capita income, and IQ: An international perspective.
(3) Kanazawa, S. (2004b). General intelligence as a domain-specific adaptation.
(4) Eppig, Fincher, and Thornhil, 2010. Parasite prevalence and the worldwide distribution of cognitive ability
We also propose a complementary hypothesis that may explain some of the effects of infectious disease on intelligence. As we mentioned, it is possible that a conditional developmental pathway exists that invests more energy into the immune system at the expense of brain development. In an environment where there has consistently been a high metabolic cost associated with parasitic infection, selection would not favour the maintenance of a phenotypically plastic trait. That is, the conditional strategy of allocating more energy into brain development during periods of health would be lost, evolutionarily, if periods of health were rare. Peoples living in areas of consistently high prevalence of infectious disease over evolutionary time thus may possess adaptations that favour high obligatory investment in immune function at the expense of other metabolically expensive traits such as intelligence. Data do not currently exist on temporal variation of the severity of infectious disease across the world over human history. For genetically distinct adaptations in intelligence to exist based on this principle, parasite levels must be quite consistent over evolutionary time.
(5) Holloway (2008: The Human Brain Evolving: A Personal Retrospective) has an interesting discussion on the brain controversy:
In the late 1970s and early 1980s, I collected autopsy data from the Pathology department at Columbia’s College of Physicians and Surgeons (now CUMS). I was interested in age, sex, and ethnic effects on brain size changes through time as might be found in cross-sectional data. Roughly 2000 cases were collected, without personal identifications, and all cases of brain pathology were culled out of the data set. The results, unpublished, were roughly the same as found in the Ho et al. (1980, 1981) work on a sample from Milwaukee, which indicated that African American brains were statistically significantly lower in weight than were European American brains, that is, of course referring to the mean values. Ho et al. (1980) concluded that cultural effects were the reason behind the difference. Interestingly, Lieberman (2005) in his review of Rushton’s (2000, 2002) claims regarding ethnic (racial) differences in brain sizes and behaviors ignored this work by Ho et al. Needless to say, Tobias’s oft-cited paper on brain weight collecting methods (Tobias 1970) was cited to claim that autopsy data on brain weights are useless. Unfortunately, however problematic such data are, one tends to forget that autopsies are not done discriminately. Once the body is on the morgue slab, the autopsy is conducted in exactly the same fashion irrespective of the cadaver’s race, and thus comparisons of such data collected by the same anatomist or medical examiner are surely valid, depending on which variables are being compared. Comparing data collected by different examiners may of course be difficult, and perhaps statistical metaanalyses would be in order. To my knowledge, none exists.Simply put, this research area remains an intensely political and near-suicidal enterprise. (Indeed, one colleague suggested I should incinerate the data; another suggested this kind of study had led to his relatives perishing in the Nazi concentration camps.) The continuing gap in African American and European-descent test scores on various cognitive tests (particularly IQ) throughout the United States and the world (Lynn & Vanhanen 2006) is a source of tremendous concern and acrimonious debate. Indeed, Jon Marks claimed he “outed” me as a “racist” (Marks 2000; see Holloway 2000 for reply) in his biological section of the American Anthropologist Newsletter because I had the temerity to defend Arthur Jensen against Loring Brace’s assertion that Jensen was a bigot. I had read much of this literature (e.g., Jensen 1998) including Jensen’s infamous 1969 piece in the Harvard Law Review and did not find him a racist. I remain appalled at our discipline, which regards him as such and which invented the appellation “Jensenism” to tar and feather him. I remain interested in the possibility that different populations have variation both in their brains and their behavior, but the issue is so politically incorrect that one cannot even approach such a study with anything but trepidation. (For example, the Annual Review article by Freedman & DeBoer 1979 was declared by sociocultural students at Columbia as racist and therefore not to be read!) If one disbelieves there are populational differences in the weight and/or structure of the brain, one should examine the papers by Klekamp and his colleagues, particularly regarding the finding that the primary visual striate cortex of Australian aborigines is significantly larger than in brains from people of European descent (Klekamp et al. 1994). This paper is, to my knowledge, the only paper published since the 1930s that demonstrates a real difference in brain morphology between modern populations (the last compilation of some of these earlier studies on brain morphology differences between different populations can be found in C.J. Connolly’s 1950 book, External Morphology of the Primate Brain, which is a sort of bible for most people working in paleoneurology. See also Kochetkova 1978.) Of course, there is Gould’s Mismeasure of Man, another bible of sorts, which should be read along with Michael’s (1988) Current Anthropology paper, which found that Morton’s rankings were correct and which Gould ignored in his later editions of the same book. There is certainly no evidence that Paul Broca used his elbow on the scales when measuring brains of peoples of European descent! Additional autopsy data sets await my attention, including some 5000 cases from Hong Kong, collected by my colleague Philip Beh, and ∼7500 cases from Singapore, the latter of multiple ethnicities. I hope to get to these data sets when I retire.
References
Ash and Gordon, 2007. Paleoclimatic Variation and Brain Expansion during Human Evolution
Bailey and Geary, 2010. Hominid Brain Evolution: Testing Climatic, Ecological, and Social Competition Models
Beals, et al., 1984. Brain Size, Cranial Morphology, Climate, and Time Machines
Brody, 2003. Jensen’s genetic interpretation of racial differences in intelligence: Critical evaluation
Gignac et al., 2003. Factors influencing the relationship between brain size and intelligence. In: Nyborg H, Ed. The scientific study of general intelligence: Tribute to Arthur R. Jensen.
Herskovits, 1930. The anthropometry of the American Negro
Hubbe et al., 2009. Climate signatures in the morphological differentiation of worldwide modern human populations
Hunt and Carlson, 2007. Considerations relating to the study of group differences in intelligence
Hwang, et al. 1995. Study on the adult Korean cranial capacity
Isamah, et al., 2010. Variability in Frontotemporal Brain Structure: The Importance of Recruitment of African Americans in Neuroscience Research
Jensen, 1998. The G-Factor
Kanazawa, 2008. Temperature and evolutionary novelty as forces behind the evolution of general intelligence.
Lynn, 2006. Race differences in intelligence.
McDaniels, 2003. Big-brained people are smarter: A meta-analysis of the relationship
between in vivo brain volume and intelligence.
between in vivo brain volume and intelligence.
Mekel-Bobrov, 2007. The ongoing adaptive evolution of ASPM and Microcephalin is not explained by increased intelligence and Microcephalin is not explained by increased intelligence
Montgomery, 2010. Brain Evolution: Microcephaly Genes Weigh In.
Peper et al., 2007. Genetic influences on human brain structure: A review of brain imaging studies in twins
Pietschnig, Zeiler, and Voracek, Unpublished. Of valid concerns and invalid effects: Meta-analyzing associations of in-vivo brain volume and IQ.
Posthuma et al., 2002. The association between brain volume and intelligence is of genetic origin.
Odokuma, Igbigbi, Akpuaka, and Esigbenu, 2010. Craniometric patterns of three Nigerian ethnic groups
Rushton and Ankney, 1999. Size matters: a review and new analyses of racial dierences in cranial capacity and intelligence that refute Kamin and Omari
Rushton and Rusthon, 2001. Brain size, IQ, and racial-group differences: Evidence from musculoskeletal traits
Rushton and Rusthon, 2004. Progressive changes in brain size and musculo-skeletal traits in seven hominoid populations
Rushton and Ankney, 2009. Whole Brain Size and General Mental Ability: A Review
Rusthon and Jensen, 2010. Race and IQ: A Theory-Based Review of the Research in Richard Nisbett’s Intelligence and How to Get It
Shockely, 1972. Dysgenics, Geneticity, Raceology: A Chalenge to the Intelectual Responsibility of Educators
Smith and Beals, 1990. Cultural correlates with cranial capacity
(Source: abc102.wordpress.com)


No hay comentarios.:
Publicar un comentario